Live dashboard
See WAN traffic, In/Out history, Internet latency, availability and top consumers.

Native macOS application
Follow inbound and outbound traffic, connected devices and Internet quality. Select important equipment, define thresholds and get notified at the right time.
 Coming soon
Features
See WAN traffic, In/Out history, Internet latency, availability and top consumers.
Search and sort UniFi clients by name, IP, MAC, network, connection and bandwidth.
Add important devices and configure individual download and upload thresholds.
Receive local notifications and query your network with Spotlight, Siri and Shortcuts.
Preview
Captured using live data supplied directly by a local UniFi controller.
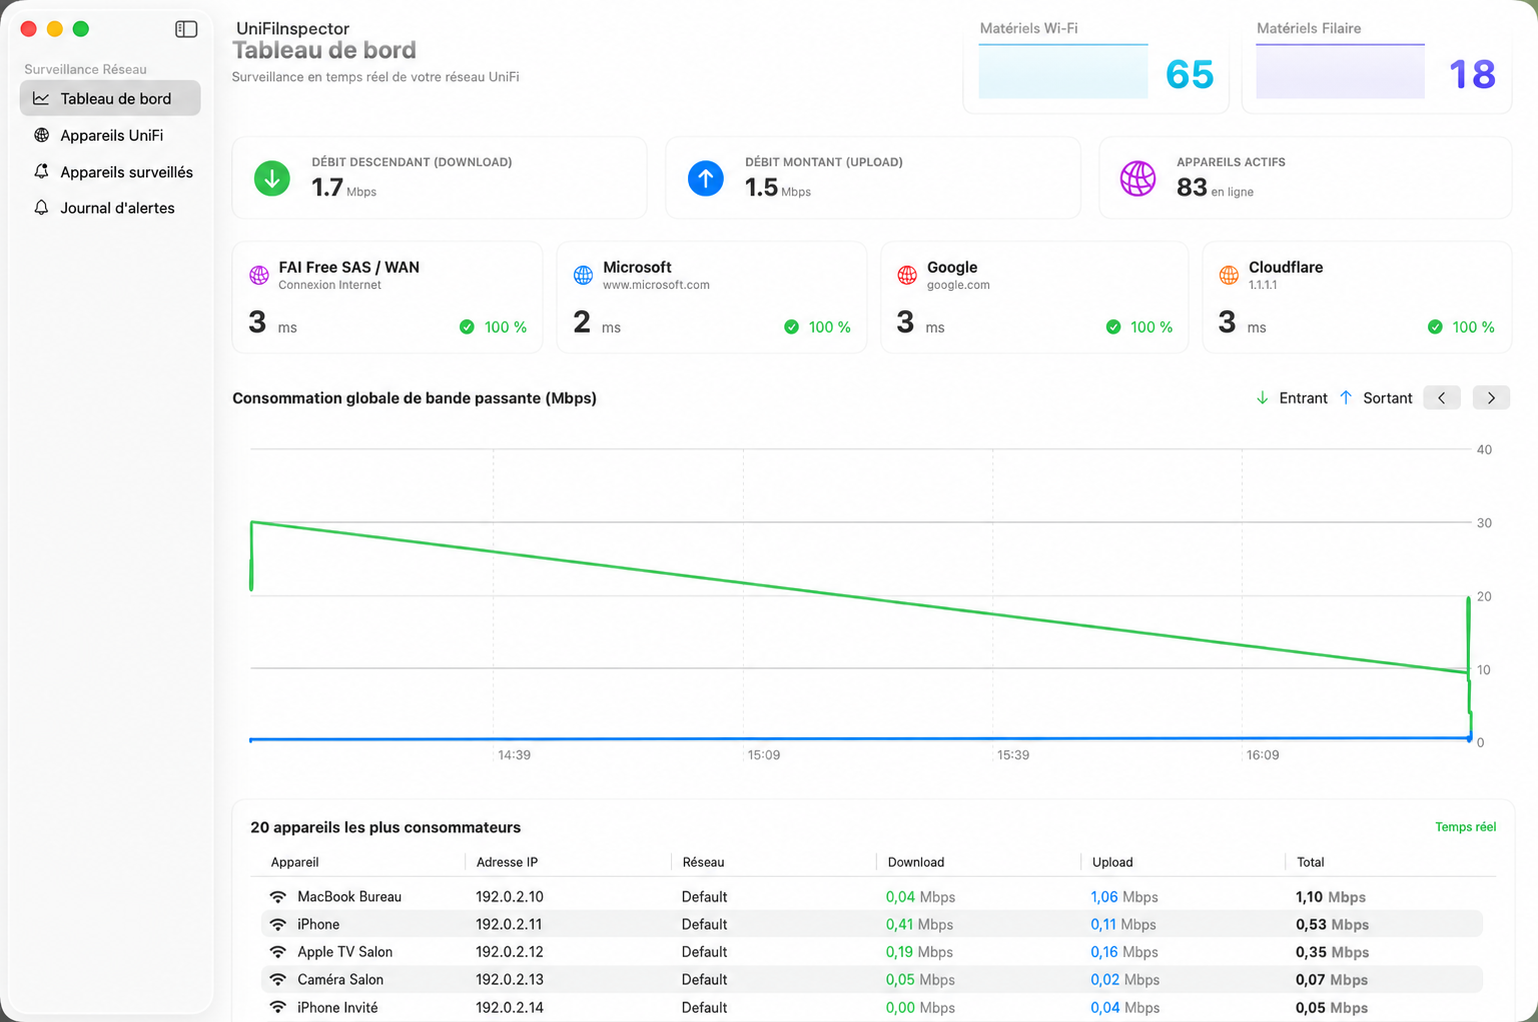
Traffic, Internet quality and consumers are brought together in a live view.
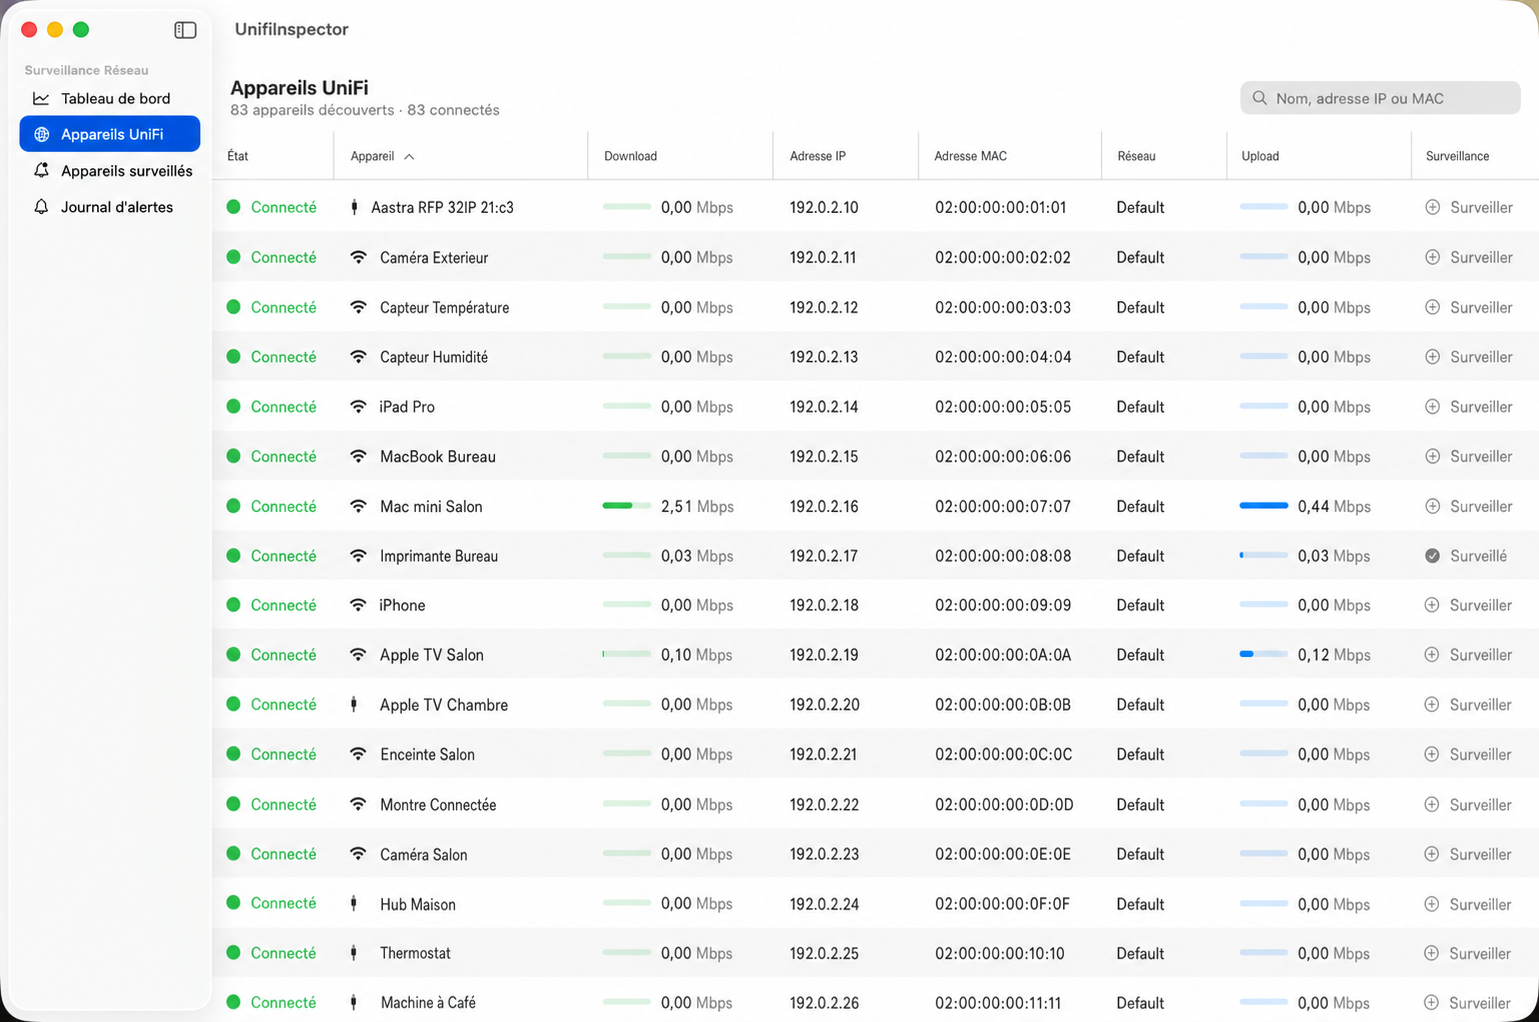
Search, sorting and bandwidth indicators make large networks easier to inspect.
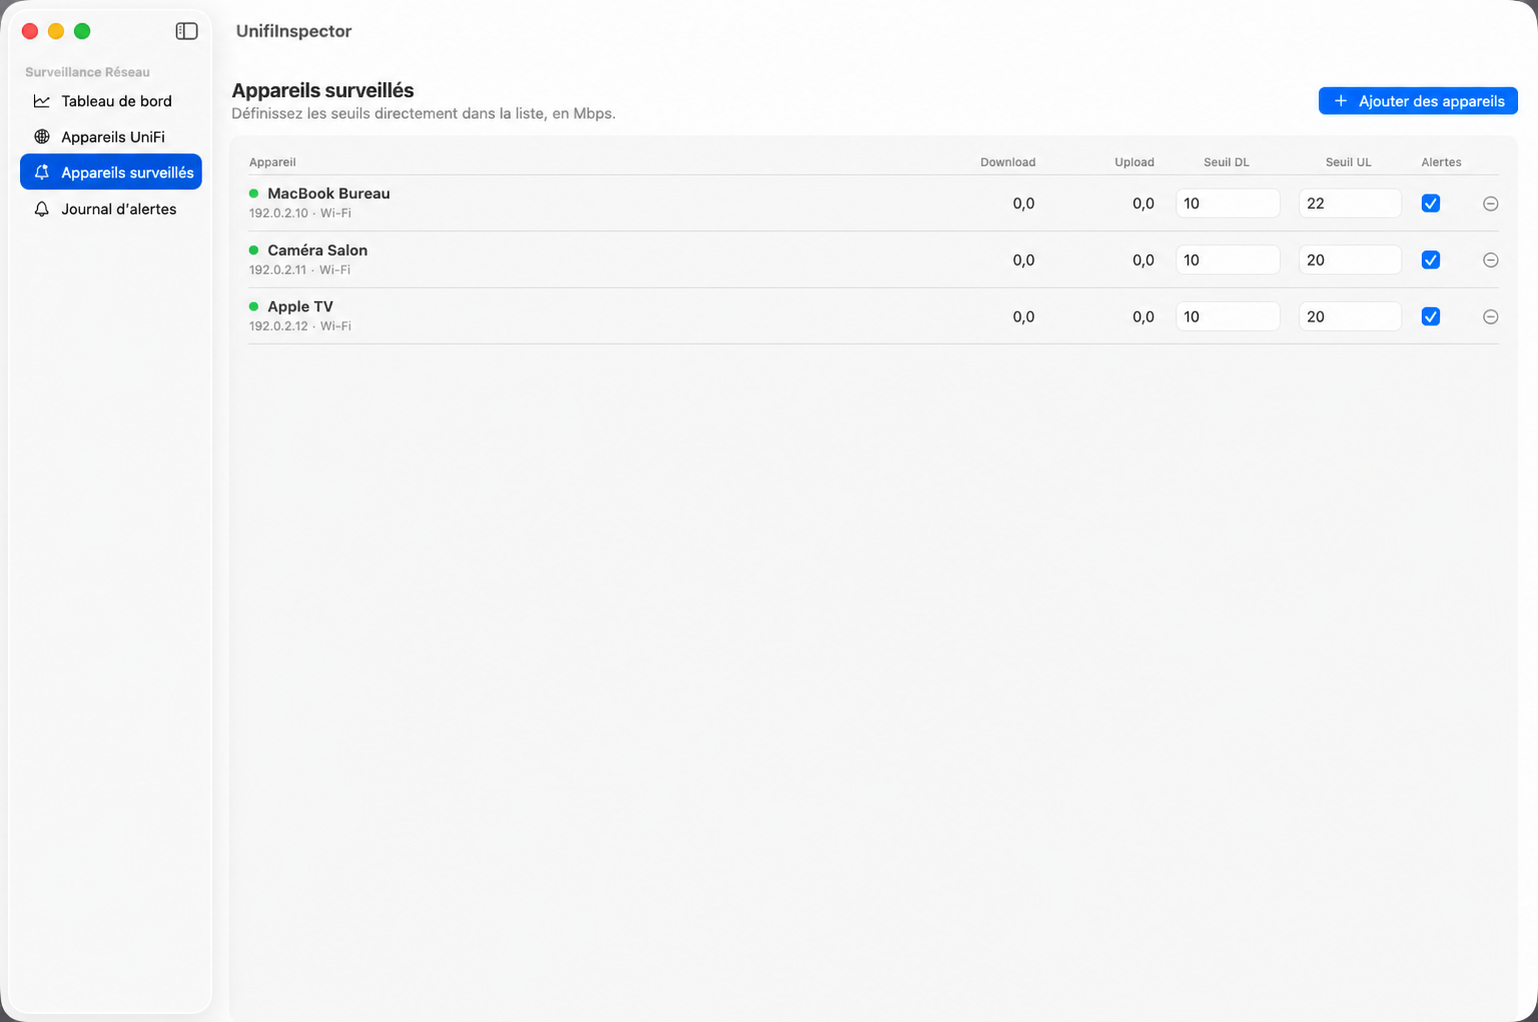
Each monitored device has its own thresholds and notification setting.
Private data
AetherUnifi connects directly to the UniFi controller you configure. Rapinology receives no device names, IP or MAC addresses, or traffic measurements.
No ads, tracking or analytics service.
Your API key is stored in macOS Keychain.
Preferences, history and alerts remain in the app container.
To erase the data, remove the app and its container, then delete the AetherUnifi Keychain item. Notifications can be disabled in System Settings.
Support
Include your macOS version, UniFi console model and AetherUnifi version. Never send your API key.
support@rapinology.com →