Trend 5 readings
- Trend
- Slope
- Confidence
- Forecast
- Time to threshold

App for Homey Pro
Turn any sensor into a trend: rising, falling or steady, with the pace.
In development v1.1.1
Any numeric sensor becomes a trend: rising, falling or steady, with the pace per hour and a confidence that says by how much the slope exceeds the sensor's own noise. Add a forecast at a chosen horizon and the time left before a threshold is reached. A temperature climbing two tenths an hour does not call for the same response as one climbing two degrees.
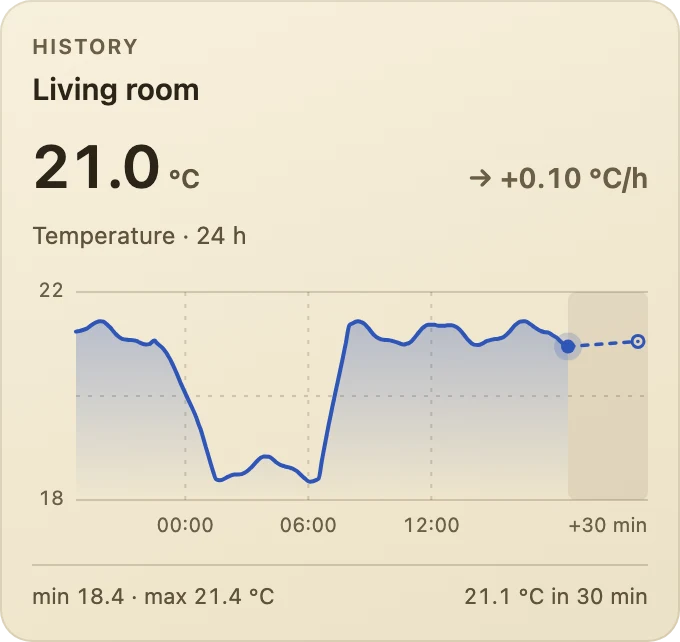
The value and its slope, then the curve read from Insights over one hour, six hours, a day or seven days, as a line or an area, with the forecast dotted and the threshold when it is within range.
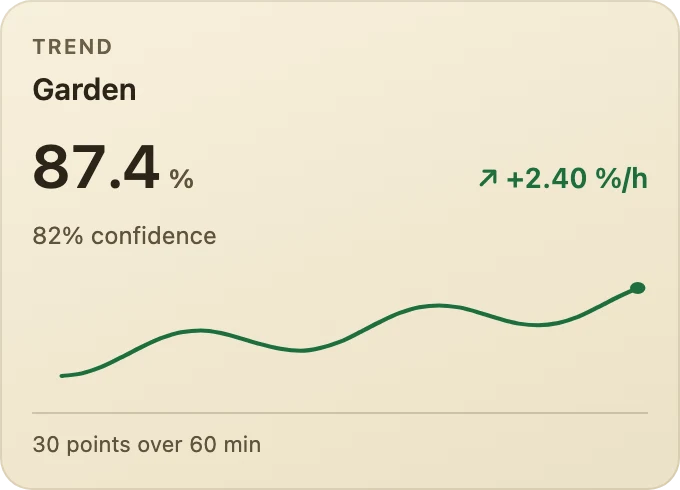
The latest reading and its slope per hour, the confidence, a smoothed curve over the observed window, and the time to the threshold when there is one. While points are still missing, or if the signal is too irregular, the tile says so.
A trend is easy to announce and hard to stand behind: two readings are enough to draw a line, and a noisy sensor draws a new one every time. Here is what the app does so that it says “it is rising” only when it really is.
01
couverture < 60 % de la fenêtre ou n < 10 → compléter par Insights
After an install, an update or a restart, the app only has the readings it had saved, sometimes none at all. If they cover less than 60 % of the observed window or number fewer than ten points, it reads the sensor's Insights history, at the finest resolution that covers the window, and only uses it to fill the gaps: real readings take precedence. No computation and no card fires before that read is over, capped at twenty seconds.
02
ṽᵢ = médiane{ vⱼ : |tⱼ − tᵢ| ≤ L ⁄ 2 }, L = 3, 5 ou 10 min
Network throughput or instantaneous power arrive in bursts. Theil-Sen withstands an isolated spike, not a series of bursts, and the curve would turn into a saw blade. On request, each reading is therefore replaced by the median of the readings taken within a window of three, five or ten minutes centred on it: the median discards a burst shorter than half the window instead of spreading it over its neighbours, and the median of a straight line is the line itself, with no lag. At the end of the series, the window is truncated rather than shifting the whole curve. The setting is off by default.
03
pente = médiane des (vⱼ − vᵢ) ⁄ (tⱼ − tᵢ), pour toutes les paires i < j
The slope is not fitted by least squares but taken as the median of the slopes of every pair of points. An outlier only enters the pairs that contain it, a minority, and the median discards it. Least squares, by contrast, minimises squared deviations: one wild point then outweighs all the others together. Over three hundred points that is 44,850 pairs, a few milliseconds.
04
σ = 1,4826 × médiane( |rᵢ − médiane(r)| ), avec rᵢ = vᵢ − (a + b·tᵢ)
Noise is measured on the deviations from the line, not on the raw values: a clear rise is not noise. The median absolute deviation is used, which the factor 1.4826 turns into a standard deviation. A floor guards against a trap: on a quantised sensor, an anemometer reading whole kilometres per hour for instance, more than half the deviations can be identical and the estimate fall to zero. Noise is therefore never claimed finer than half the sensor's own step.
05
σ_pente = σ ⁄ ( √n × σ_t ) × 3600
The noise of a reading is not the noise of the slope. The more points there are, the surer the slope, hence the square root of n; and the more they are spread over time, the surer still, hence the standard deviation of the timestamps in the denominator. Ten readings taken within a minute say far less about a trend than the same ten spread over an hour.
06
zone morte = k × σ_pente, avec k = 3 par défaut
Below three times its own uncertainty, a slope cannot be told apart from noise: the app reports “steady” rather than inventing a movement. The factor is adjustable, and it can be replaced by a fixed threshold in units per hour when you know what you are looking for.
07
fiabilité = min( 100 ; 50 × |pente| ⁄ (k × σ_pente) )
It says by how much the slope exceeds its own noise, and nothing else. Fifty means the slope is exactly the deadband, one hundred that it is twice it. A clear slope on a noisy sensor can therefore be highly reliable, and a tiny slope on a precise sensor not reliable at all.
08
v̂ = a + b·t_dernier · prévision = v̂ + b × horizon · échéance = (seuil − v̂) ⁄ b
Both start from the model's value at the last instant, never from the last raw reading: extrapolating from a noisy point would carry that noise forward. The time to a threshold returns nothing in the three cases where a number would lie, namely a slope inside the deadband, a threshold already crossed or on the wrong side, and a time beyond twenty-four hours, a distance at which the slope will have changed several times.
09
changement retenu si confirmé 2 fois de suite ET direction précédente tenue ≥ 300 s
This is the only thing that stops a shutter from flapping around its threshold. A change of direction is accepted only after two consecutive confirmations, and only if the previous direction held for at least five minutes. Both conditions are required together.
10
fenêtre coupée en deux, chaque moitié ajustée ; signes opposés et hors zone morte → pic ou creux
A single line cannot see a peak: it averages it away. The window is therefore cut in two halves, each fitted separately, each needing at least four points. If both slopes clear the deadband and have opposite signs, the app reports a peak when the first was rising, a trough when it was falling.
Homey writes an automation in three parts: when something happens, and if a condition holds, then do this. Anything on a lighter background, such as radius, is a parameter you set in the Flow. Every condition also exists in its negative form, which Homey flips with one click.
When 5
And 4
Sensor Trends 1.1.0 brings a new History widget and a smoother Trend tile.
Edit a dashboard, add a widget and choose Sensor Trends, then Trend or History. Pick the trend device from the list (leave it empty to show the first one), set the period and style for History, then choose a background: deep blue, slate, plum, forest or sand.
Available in English, Dutch, German, French, Italian, Spanish, Danish, Norwegian and Swedish.